Breakdown Notes
Make notes, diagrams and mindmaps in your browser: It's free and requires no registration
Statistics is all about calculating probabilities. When calculating probabilities one can start of by saying every possible outcome is equally likely. But that's not always the best starting point. Sometimes you can make assumptions about what outcomes are more or less likely, or pretty much impossible. For instance, if you want an estimation of the batting average of some rookie in baseball based on his or her first 100 tries, it seems better to start of with the averages of previous rookies, in stead of a distribution in which a .999 average is just as likely as .250.
Bayesian statistics offers a way to incorparate your beliefs or expectations into experiments: the starting point of your calculations are your expectations, and for each experiment this expectation is updated with the result of the experiment. This can result in more accurate predictions, that is, as long as your expectations are reasonable....
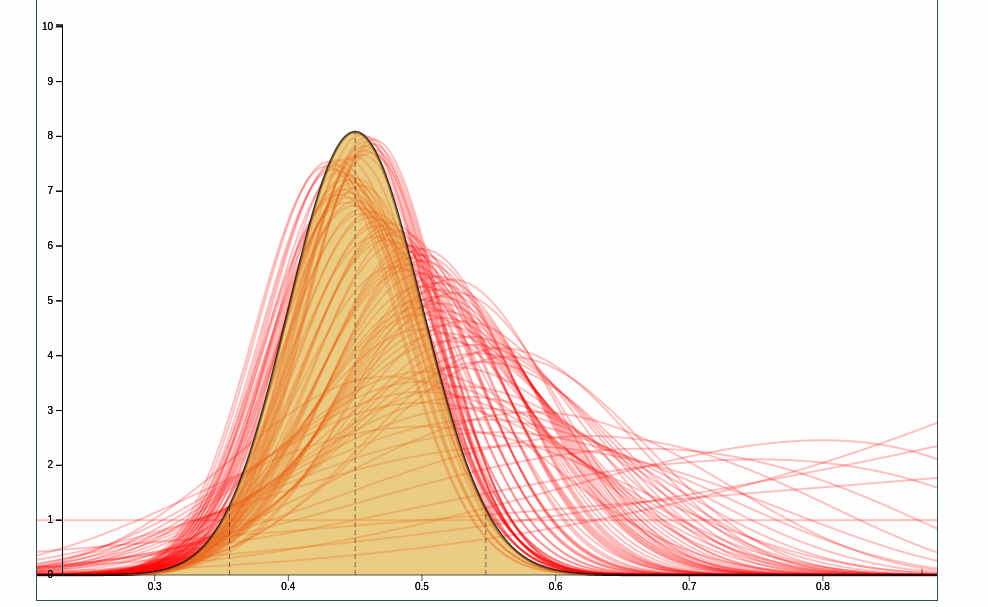
This website lets you play around with all this. You can choose your prior expectations and then run a simulation which shows each update. The simulations assume a binary outcome that is 'hit or miss', 'heads or tails' etc. Using a beta distribution, a probability density function is calculated and displayed: the higher the density for a particular success rate (on the x-axis), the higher the probability of that success rate.
By then changing your prior expectation, the number of updates or the actual success rate and running the experiment again, you can get a feel for the differences the assumptions and/or the number experiments make. You can compare the final result with the results of your previous experiments by pressing "compare".
First choose the actual success rate. Ths will be used to simulate to succes or failure of your experiments. Think fairness of a coin, hit percentage etc.
Success rate: 0.50
Then choose the number of updates you want to simulate. Each update will be shown as a line on the chart.
Number of updates: 100
Choose the number of experiments (be it coin flips, at bats, free throws) you want to run before for each update.
Number per update: 1
Finally choose your expectation. This is the starting point of the density. You might set it to a straight line if you have no assumptions what so ever (move both sliders all the way left), or to a density around some average.
Uniform (Beta(1,1))
Hover tosses to see distribution after animation
Make notes, diagrams and mindmaps in your browser: It's free and requires no registration